Dashboard Preview
1 / 2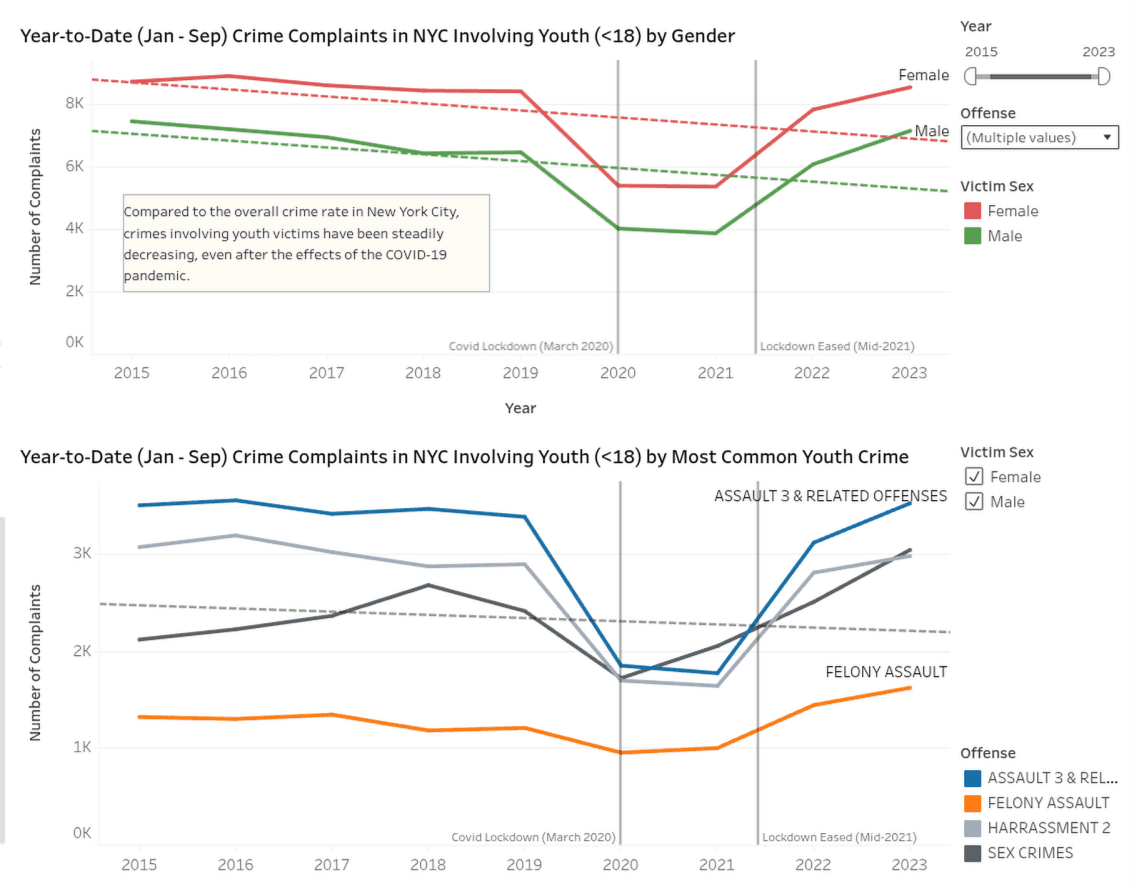

Main dashboard view showing crime across youth and crime types
Tools & Technologies
Problem
Rising concerns about youth-related crime have emerged, increasing the concern of New York parents, those with children under 18. Crimes involving minors often lack comprehensive documentation or nuanced coverage, with media narratives sometimes attributing blame to particular age groups or racial demographics. This selective framing can perpetuate harmful stereotypes. Parents seek clarity on whether crime against youth is indeed escalating and if their children’s safety is at risk. This data story aims to present transparent analysis of youth-related crime trends across New York City and clarify patterns that are often overlooked.
Results
The dashboard highlights the complexity of the crime rate in New York. hile overall youth crime trends can be compared to citywide patterns, the risk for youth varies significantly by factors like time of day, location (borough and precinct), and demographics. Youth are most at risk during after-school hours and that the demographics of both victims and suspects show specific patterns, such as the overrepresentation of certain racial groups and a post-2020 shift involving older suspects. Ultimately, this data story can be used to explore the crime trends for users.
Key Insights
Youth crime patterns decreased significantly during Covid-19 but rises again after 2021
Crime incident spikes in the afternoon, espeecially during school days
There are shift of location density in precints level
Sex crime rank especially harrasment highest for youth crime
Data source: NYPD Complaint Data Historic • Last updated: December 2023